
How are Skeena Salmon Energy Levels changing over time? (see data page for 2016 and earlier graphed results and raw data)
In 2012 we sampled sockeye salmon who had just returned to the mouth of the Skeena River from feeding in the North Pacific. We tested twice at the height of the run just twenty miles inland, at the Tyee Test Fishery, and found their stored fat averaged 14.5 % of their gross body weight.
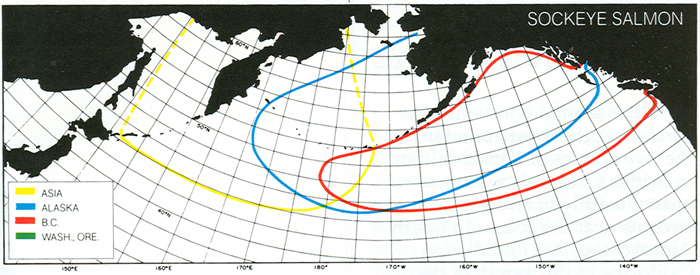
Skeena sockeye join other salmon out in the North Pacific feeding range.– DFO image
A warm blob in the N. Pacific in 2015 and 2016 caused general concern that salmon food supply might be impacted by the warm water.
The Skeena sockeye run is an ideal run to sample to learn about energy levels of returning salmon;
- They are a fairly homogeneous run with roughly 90% originating in Babine Lake so changes in lipid content over time will not be confounded by changes in stock composition.
- They have an extremely high fat content when they arrive at Tyee near the start of their up-river migration. No threshold has been established but it has been estimated they use stored oil equivalent to 9.5% of their gross body weight to swim the long distance upriver to their Babine Lake spawning grounds. When they arrive they need approximately an additional 3% Gross Lipid content to mate and spawn. So they may need to start with about 12.5%.
- They feed in the same area of the North Pacific (the Alaskan Gyre) as Fraser sockeye and lipid levels of returning Skeena sockeye might serve as an indication of general feeding success related to these offshore conditions.
We tested Skeena sockeye over the 2016 run period (at Tyee) and this is what we found:
- Their stored fat at the peak of the run averaged just less than 12.0% (compared to 14.5% in 2012 during the peak).
- The fat content varies greatly over individuals; when the average was 14.5%, in 2012, the vast majority of individual sockeye had enough stored fat to make it to their spawning grounds and spawn, but the lower 12.0% average, during the peak of the run in 2016, is reflected in a great number of individuals with fat content so low it might influence in- river mortality rates.
- The lipid level of the returning sockeye varied not only between years (2012 and 2016) but over the period of the run-see the graph.
- The gross lipid level readings provided by this project supply additional information about salmon condition which is not provided by other condition measures. See graph showing lack of relationship between K factor and lipid level.
We would like to thank T. Buck Suzuki Environmental Foundation for this project.
$20,000 funding was provided in 2016 by Tides Canada Foundation – Wild Salmon Ecosystem Fund
$2,500 was provided by Pacific Salmon Foundation in 2017
There have also been a considerable number of volunteer hours and private donations