
Graphs of Preliminary Data (see links to raw data below)
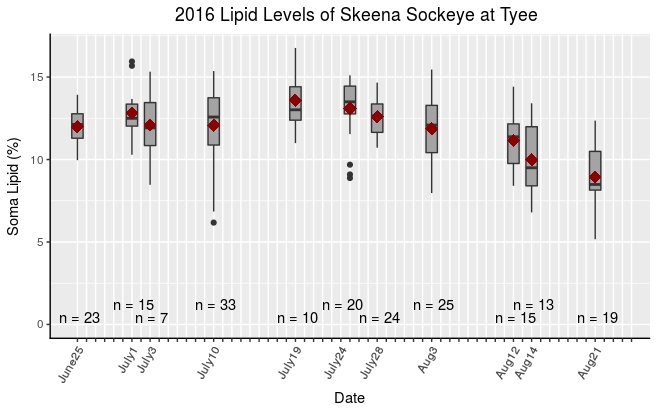
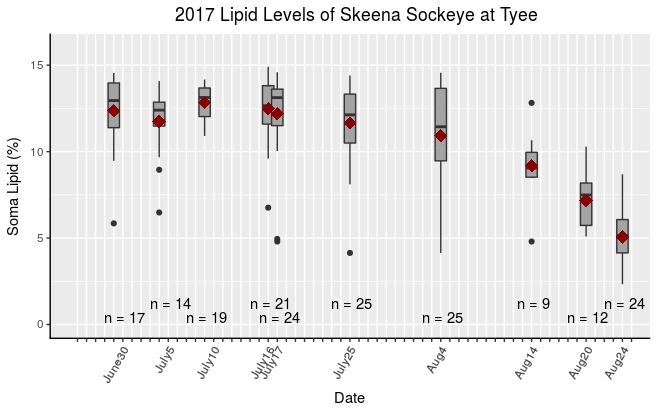
Whole body lipid levels of sockeye salmon sampled at the Tyee Test Fishery (20 km upriver) on the Skeena River in B.C. Canada. Boxplots represent medians (solid lines), means (oblique red squares), 25th and 75th percentiles (ends of boxes), 10th and 90th percentiles (whiskers) and outliers (black circles). (click on image for higher resolution)
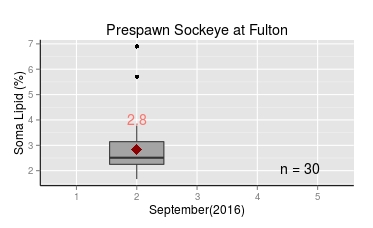 Whole body lipid levels of Skeena River sockeye salmon sampled at the the entrance to the Fulton River (Tachet) Spawning Channels. Total migration distance (and time) from marine environment: Skeena River, 380 km. (approx 3 weeks) plus Nilkitkwa Lake and adjoining Babine Lake, 84 km. (approx 3 weeks). Elevation 725 m. Red text is the mean.
Preliminary Raw Data…
(note: one sample was removed as out of range; 2012 Kitwanga sample with operator comment “dry… perhaps frozen” measured at 38%)
sockeye data
2012-Sockeye-Lipid-Levels-at Tyee
2015-Sockeye-Lipid-Levels-at-Tyee
2016-Sockeye-Lipid-Levels-at-Tyee
2016-Sockeye-Lipid-Levels-at Babine
chinook data
condition k factor vs lipid content (2012 and 2016)